Matplotlib is a popular Python library used for creating static, interactive, and animated visualizations in Python. It provides a wide variety of plotting functions and customization options to create high-quality plots for data analysis and visualization purposes.
pip install matplotlib
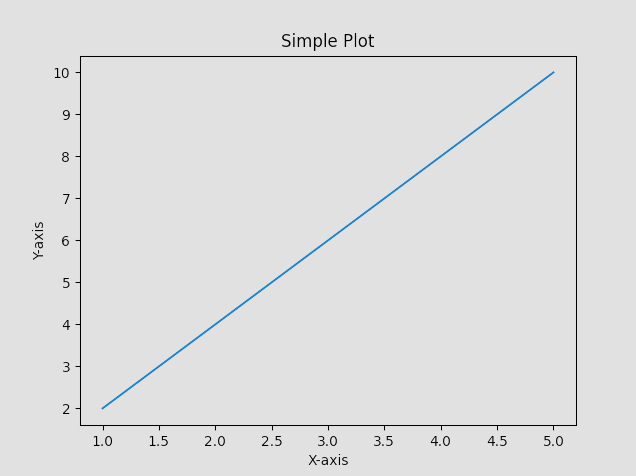
Here’s a basic example of how to create a simple plot using Matplotlib:
import matplotlib.pyplot as plt

# Sample data
x = [1, 2, 3, 4, 5]
y = [2, 4, 6, 8, 10]

# Create a plot
plt.plot(x, y)

# Add labels and title
plt.xlabel('X-axis')
plt.ylabel('Y-axis')
plt.title('Simple Plot')

# Show the plot
plt.show()
In this example:
- We import the
matplotlib.pyplotmodule asplt. - We define some sample data in lists
xandy. - We use the
plot()function to create a line plot withxon the x-axis andyon the y-axis. - We add labels to the axes using
xlabel()andylabel()functions. - We add a title to the plot using the
title()function. - Finally, we display the plot using the
show()function.
Matplotlib provides many other types of plots such as scatter plots, bar plots, histograms, pie charts, etc., and offers extensive customization options for colors, styles, annotations, and more to suit your needs. You can refer to the Matplotlib documentation for more advanced usage and customization options.